Joining the Dots
The path of interest rates, and specifically US interest rates, is of critical importance to financial markets. The Federal Reserve has just embarked on the most aggressive policy tightening in decades to try to quell elevated inflation. At their most recent meeting, the Federal Reserve paused their series of interest rate hikes but indicated they might need to resume hiking in the months ahead. “The committee thought overall that it was appropriate to moderate the pace, if only slightly,” Jerome Powell said. “That gives us more information to make decisions. We may try to make better decisions. It allows the economy a little more time to adapt as we make our decisions going forward.” The Fed’s projections or “dot plot” indicated that the committee now expects rates to remain higher for longer throughout 2024. The stance is aimed to give the Fed maximum flexibility going forward as the data comes in.
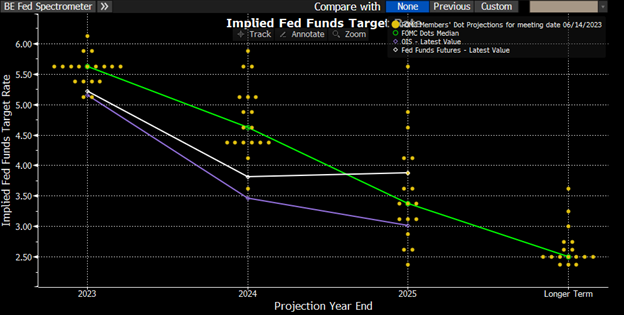
At every opportunity, the Fed has pushed back strongly against investor expectations that officials would be cutting borrowing costs by year end, saying they expect inflation to decline slowly. In the prior meeting, Powell said “It will take some time, and in that world, if that forecast is broadly right, it would not be appropriate to cut rates and we won’t cut rates.” This sentiment is expressed in the projections of the Fed board members or “the dots” shown in the chart above. The green line represents the average. However, market pricing indicates that despite their rhetoric, the Fed will be cutting by year end and aggressively by the end of next year. This is shown by the purple line.
The key question for investors is why, despite the Fed’s consistency on this issue, does the market not believe them? The key to understanding this question is to realise that they are not measuring the same thing. The Fed “dot plots” are based on their individual views of how the economy will look and hence the appropriate rate. The market pricing is based on a probability distribution of potential outcomes. For example, the Fed view could be that at year end, the economy will be OK and that rates will be 5%. If the market pricing is 4%, it doesn’t necessarily mean this is where rates will be. It could mean there is an 80% probability that rates will be 5% and a 20% chance that the economy will crash, and rates will be back at zero. This is a huge simplification to illustrate the point. The main takeaway for investors is that if rates do indeed come back down sharply, it is not going to be for reasons that are good news for equities.